With 2024 officially being the year of OpenStreetMap vector maps let’s do a deep-dive into vector maps: their history and how the underlying vector tiles work in detail.

Vector Maps History
To understand how revolutionary vector maps were we have to go back in time to the early 2010s.
One Direction is raising to international fame and raster maps are at the height of their popularity.
Folks creating raster web maps rendering OpenStreetMap data into beautiful 256x256 pixel images.
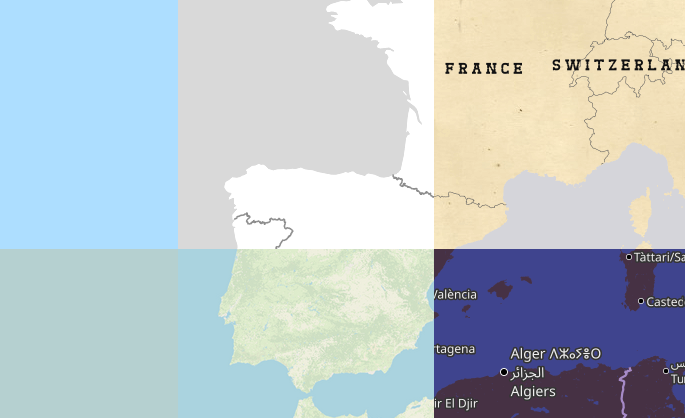
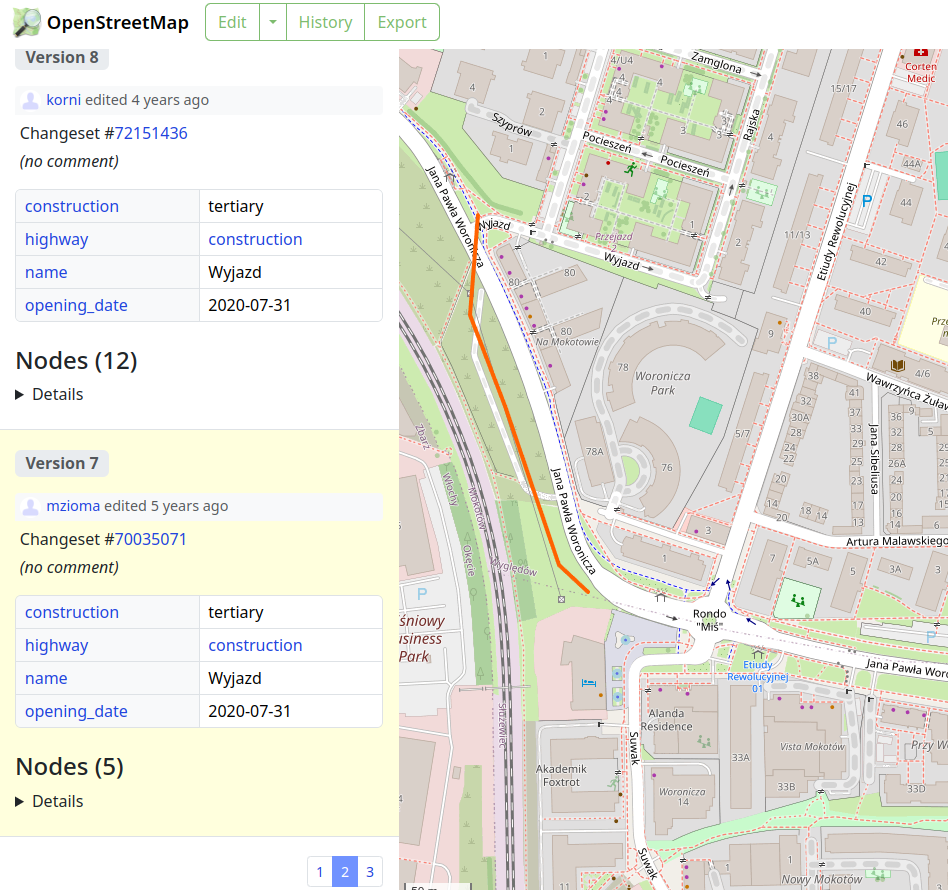
But raster maps come with limitations: when you rotate the map the labels stop facing you; you can’t customize pre-rendered maps to specific use-cases on the fly; there is no fractional scaling between zoom levels.
All of these problems are unthinkable nowadays: here is one example where Jochen wrote about Wikipedia struggling with pre-rendering multilingual maps for over 200 languages because they can’t change their map’s language on the fly.
In December 2010 Google introduced vector maps in Google Maps on Android.
I highly recommend you stopping here to go skim their announcement blog post where they show-case what vector maps allow them to do.

With WebGL rendering technology reaching browsers in 2013 folks like Michal Migurski start experimenting with rendering maps in the browser instead of displaying raster images.

In April 2013 the folks at Mapbox release an experimental vector tile format for rendering vector maps followed by a first go at a browser-based canvas and WebGL renderer.
This experimental vector tile format would end up becoming the industry standard Mapbox Vector Tile (MVT) specification and the renderer would end up becoming the state of the art web map renderer Mapbox GL JS and/or Maplibre we all enjoy to this day.
Let’s have a look at this vector tile specification in detail allowing for vector maps.
The Mapbox Vector Tile (MVT) Specification
The Mapbox Vector Tile specification outlines how to encode geographic data into vector tiles.
The most common use case is encoding geometries and features from OpenStreetMap for a browser based renderer such as Maplibre.
The vector tile specification is not tied to a source such as OpenStreetMap or a renderer in particular.
The specification provides a format for encoding a single vector tile: the vector map is made up of a collection of vector tiles with neighboring tiles and zoom levels exactly as with raster maps and raster tiles.
You can find the Mapbox Vector Tile specification here.
The Mapbox Vector Tile format is based on Protocol Buffers and roughly consists of the following entity hierarchy
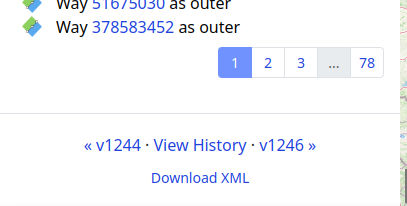
- A Tile has multiple Layers
- A Layer has multiple Features
- A Feature has a Geometry and Attributes
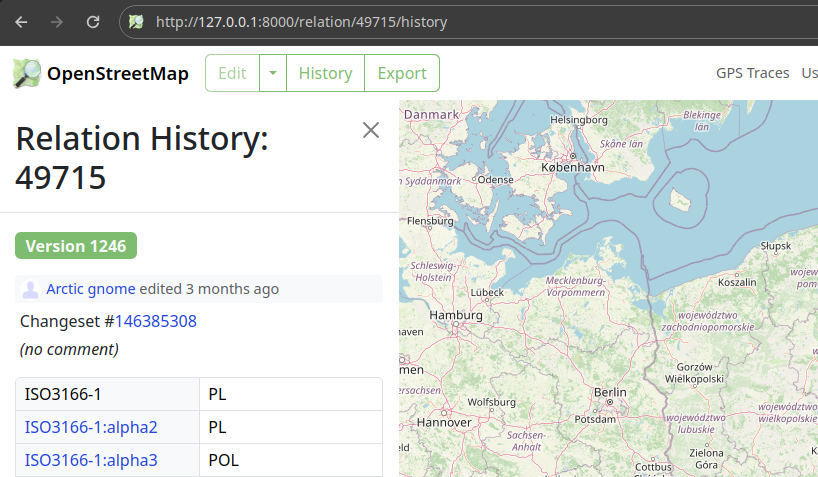
As an example: a tile with a “building” layer with multiple feature polygons and height in meters.
Geometries can be points, linestrings, or polygons; attributes are key-value pairs where the key is always a string and the value can be any type (int, float, string, ..).
The geometry encoding is mimicking the Canvas API with commands
- MoveTo
- LineTo
- ClosePath
These commands work on a square coordinate system e.g. with extent 4096 where top-left represents the origin at (0, 0).
As an example: the linestring [(2,2), (2,10), (10,10)] would look like the following
- MoveTo(+2,+2)
- LineTo(+0,+8)
- LineTo(+8,+0)
The command’s type, how often to apply the command, and the command’s parameters are all efficiently encoded as varints.
There are two Protocol Buffer core concepts worth understanding here as they’re used heavily throughout the specification: varints and zig-zag encoding.
Varints encode numbers in a variable number of bytes such that small numbers take up less space.
The most significant bit of a byte acts as a continuation flag, leaving the remaining seven bits per byte for data.
That means e.g. numbers such as 0, 1, 42, that are fitting into seven bits only take up one byte instead of e.g. 4 byte with an int32 data type or 8 byte with an int64 data type.
Zig-zag encoding allows varints to work with negative numbers, too.

Problems with The Mapbox Vector Tile (MVT) Specification
The Mapbox Vector Tile specification is a pragmatic industry standard that has allowed for massive innovation over the last decade.
That said, it’s not without problems and limitations.
One of the biggest issues is that there is no sharing of data between vector tiles: not between neighboring tiles and not across zoom levels.
If there is a road spanning multiple tiles,
- the very same road name will be inefficiently encoded in neighboring tiles on the same zoom level
- the very same road name will be inefficiently encoded in tiles up and down the zoom level hierarchy
In contrast the OrganicMaps folks with their home-grown data format efficiently share map data and make use of succinct data structures which is one reason their offline maps so small and efficient.

There are various other inefficiencies, e.g. points are inefficiently encoded to simply store two coordinates.
There has been work on a new Mapbox Vector Tile version v3 trying to overcome some of the problems and limitations and at the same time introduce new features such as: elevation, inline attributes, and splines.
You can see the work in progress in the upstream v3.0 branch.
There hasn’t been an update since 2019.
I believe it’s fair to say that we’re stuck with the Mapbox Vector Tiles specification v2 for better or worse.
The problems and limitations mentioned above are far outweighed by having a stable specification for vector tiles the broader ecosystem agrees on.
From Vector Tiles to Vector Maps
The Mapbox Vector Tile specification described above is a format for encoding and decoding a single vector tile.
Vector maps are made up of multiple vector tiles across zoom levels and there are two popular ways to package up individual vector tiles into a vector map.
The first way to package up tiles is the historic MBTiles format which initially was created for jpg and png raster maps in 2011.
The MBTiles format is a sqlite3 database file packaging up z/x/y tiles; you can use the sqlite3 command line tool to have a look at its table definitions
CREATE TABLE tiles (zoom_level integer, tile_column integer, tile_row integer, tile_data blob);
In 2016 the MBTiles format started recognizing the Mapbox Vector Tile format in addition to jpg and png raster tiles.
You can find the MBTiles specification here.
The second way to package up tiles is the more recent PMTiles format from the Protomaps folks.
The PMTiles format bundles up vector tiles in a single file just like MBTiles.
But unlike MBTiles, the major benefit of PMTiles is laying out the vector tiles in a clever way such that browsers can make Byte-Range requests against the PMTiles file.
What this means in practice is that now we can create Mapbox Vector Tiles, package them up in a single PMTiles file, and host this one file on any static file hoster.
You can find the PMTiles specification here
With vector maps data at our hands what’s missing now is a way to decode, display, and style the vector data e.g. using Maplibre and its Style Specification.
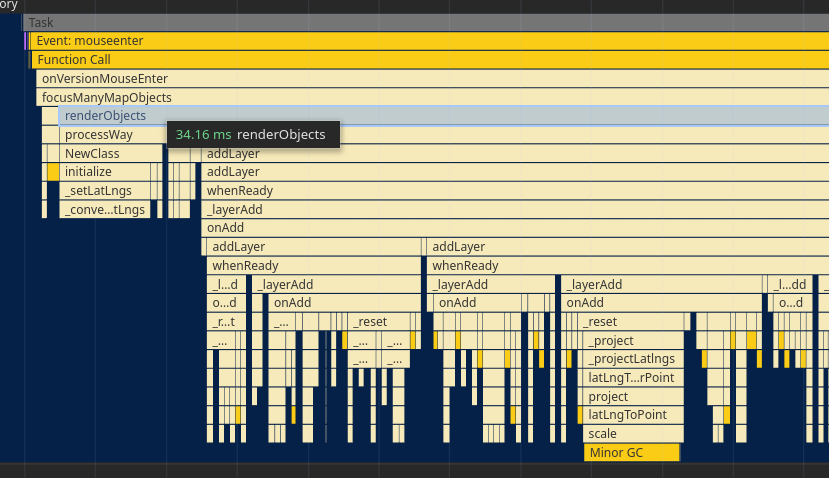
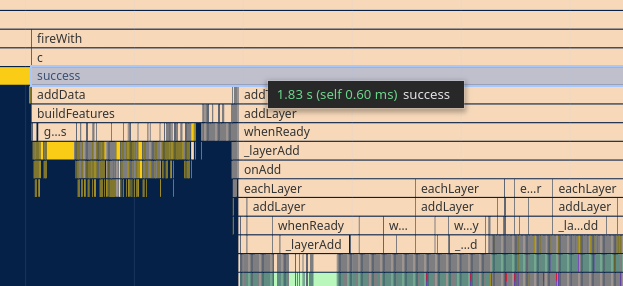
Based on the map’s viewport Maplibre fetches vector tiles, decodes the vector tile by parsing the protocol buffers, and then allows us to style the vector tile layers, features, geometries, and attributes however we want.
Create Your Own Vector Maps
Creating your own vector maps from OpenStreetMap has never been easier! To get started I recommend having a look at Maplibre and Protomaps; start for example here for inspiration.
If you want to create your own vector maps from OpenStreetMap data, good first steps are
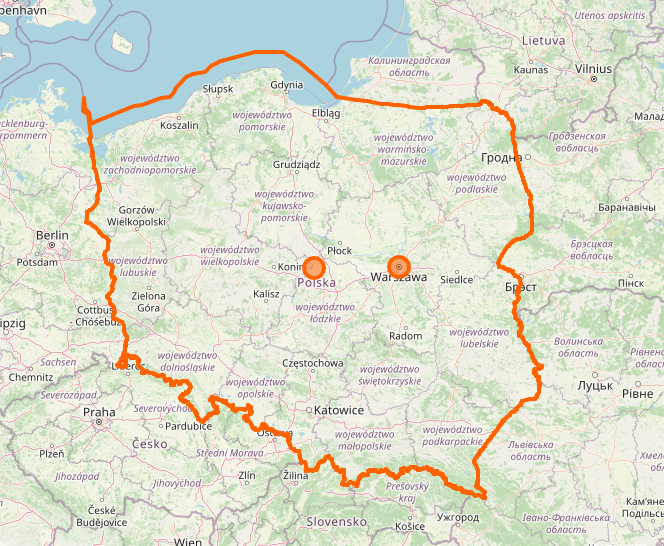
- Download a small .osm.pbf file from Geofabrik
- Use tilemaker or planetiles to generate PMTiles
- Drop the PMTiles file into the Protomaps PMTiles viewer for debugging
- Use Maplibre to visualize the vector map and styling it as you like
and then iterate from here.
Happy year of OpenStreetMap vector maps!
References


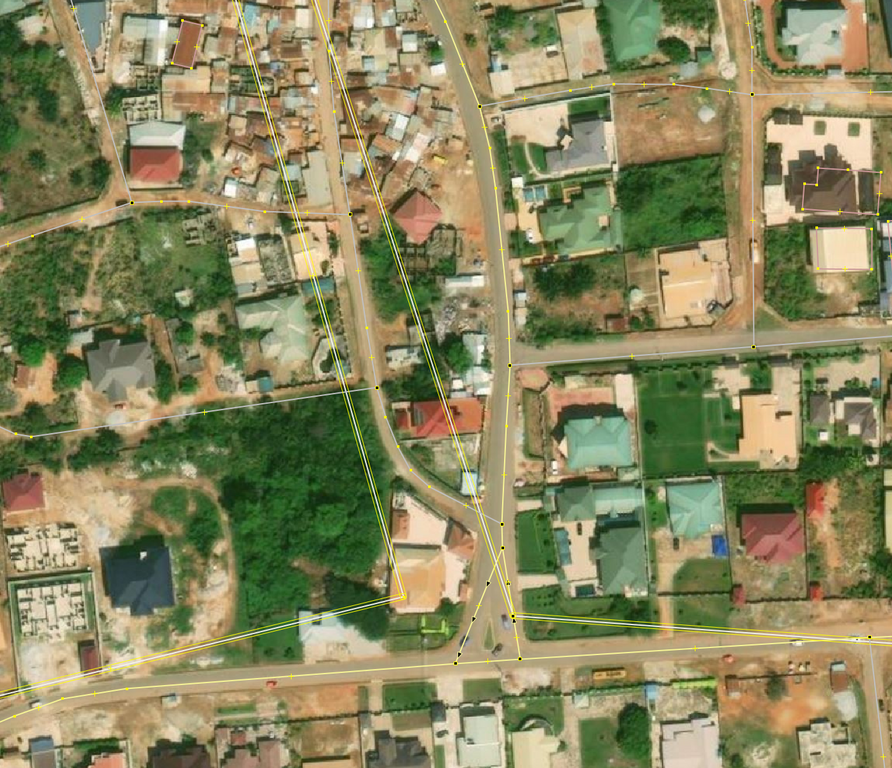 © OpenStreetMap Contributors. Screenshot from JOSM with Bing
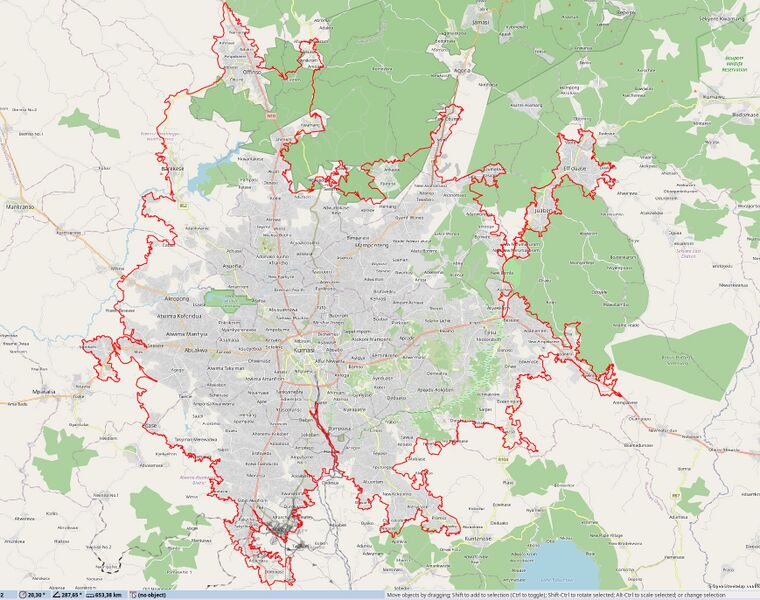 © OpenStreetMap Contributors. Screenshot from JOSM with OSM Carto
.jpg)